
Seasonality in Pictures: Part II!
Seasonality in Pictures: Part II!
Spoiler Alert: Winter is still a thing

A few weeks ago I wrote a post about the obvious seasonality in covid hospitalizations. We could see how the sunbelt got their summer spike and then the virus receded (without drastic lockdowns) as we moved into autumn.
The next prediction of the ‘seasonality theorists’ was the rise of the winter wave, and SURPRISE SURPRISE, we’re starting to see it happen!
Here’s the HHS page for 10-26-20 and 10-26-21. Same as last time, 2020 is on the left with 2021 on the right.

As predicted by the seasonality theorists, the virus begins to kick up first in places where the weather turns the quickest. Last year the Dakotas and Montana, this year Montana and Wyoming. Let’s check in a few days later:
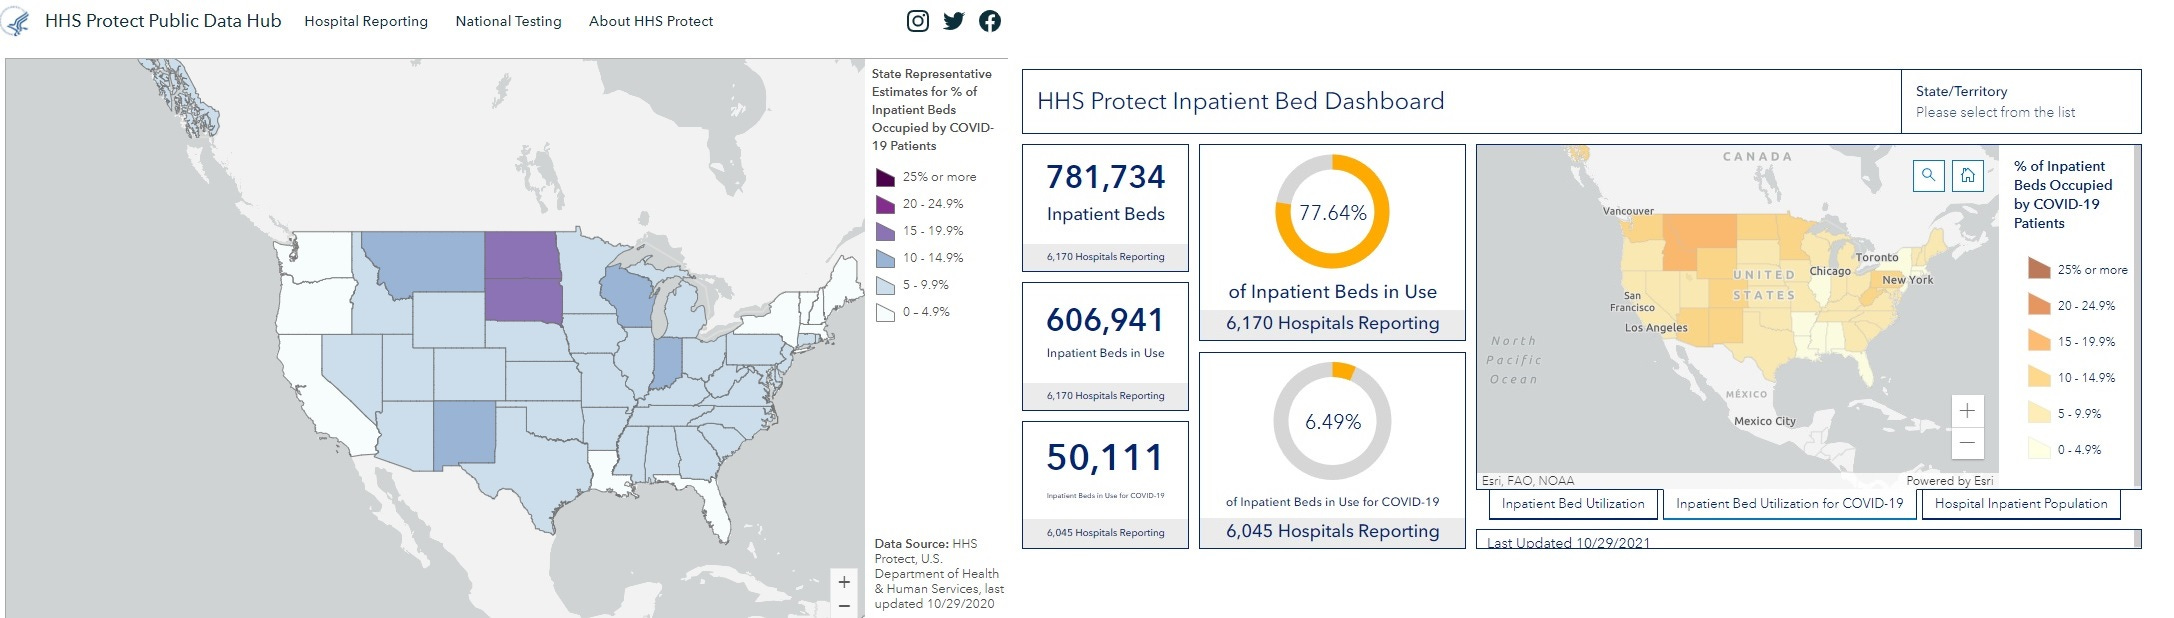
Both years the virus moves slowly during this period. In fact, I had to double check that I didn’t accidentally post the 10/26 picture on the 10/29 page. Jumping ahead to 11/9:

As predicted, as more and more areas hit their cold weather, the virus moves in. But note here that only 6.46% of our beds are actually taken up with a person who tests positive for covid. Hardly overrunning our hospitals…..
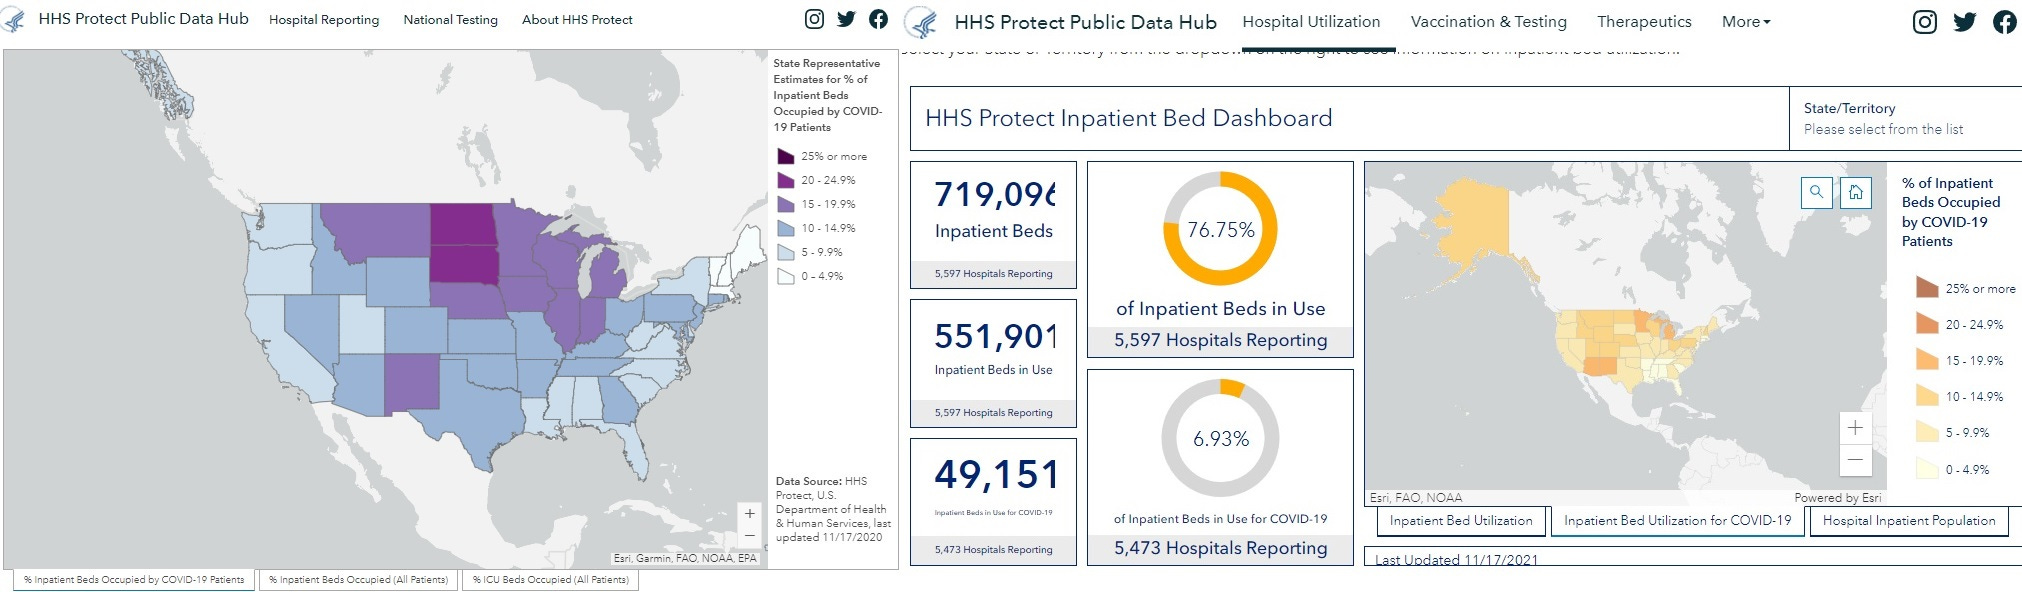
And finally we have data from yesterday. Last year, this was the first worrying winter screenshot, and also showed without a doubt the seasonal nature of the virus. This year the uptick isn’t as extreme, but is located in the same places as last year.
Nothing we do matters at all, and it’s long past time to simply move on from covid madness and politicians who push it.
Nice work. Thank you, very useful.
It would be awesome if you could do some integration of this data with temperature and absolute humidity!
https://www.zerohedge.com/covid-19/theory-why-covid-cases-started-skyrocketing-central-europe-last-month
https://journals.plos.org/plospathogens/article?id=10.1371/journal.ppat.1003194